LIWC in Practice: Applying LIWC to research questions in Genre Theory, or Toward a Science of Science Fiction
by Dr. Ryan Nichols, Philosophy, Cal State Fullerton, Orange County CA
Introducing LIWC and providing basic video introduction to its operation falls far short of enabling the traditional humanist to begin using LIWC for her own purposes. But this and the following post should close that gap somewhat by demonstrating, step by step, how we used LIWC to put the interpretations of certain humanists to the test. Specifically, in our pilot project involving genre theory, we sought to apply and test LIWC’s abilities to respond to a research question about how we ought to individuate one genre from the next.
Title page of Johannes Kepler’s De Somnium, considered (by me) the first science fiction novella. Source: Wikipedia Commons
Step 1: Identify research questions to be operationalized as queries in LIWC
This requires knowing the literature in your research area and having an understanding of LIWC and its available categories. (For LIWC categories, consult this list). In our case, I read twenty to thirty papers or book chapters about genre theory with special attention to science fiction, a longtime interest of mine. People in genre theory were spinning their wheels on a trail to nowhere, and each new generation was deeper in the mud. Scholars lacked independent criteria to assess theories of the science fiction genre. But this didn’t dissuade them from producing more theory.
We could assist this group through quantitative analysis since LIWC offers a means of establishing measurement of themes across genres. We regarded this as worthwhile since our emerging study design could actually test a subset of available interpretations of genre—the subset that was operationalizable. Darko Suvin’s crisp, clear criteria for membership in the science fiction genre came to mind: a work is science fiction if and only if it emphasizes cognition and estrangement.
Step 2: Clarifying the research question and framing hypotheses
This inspired our central research question: Does science fiction emphasize cognition and estrangement? This can be operationalized in terms of data from LIWC categories. LIWC has a cognition category (called ‘cogmech’). Working with Suvin’s concept of ‘estrangement’ was more difficult. After reflection with my co-authors Justin Lynn and Ben Purzycki, we decided to model estrangement by using LIWC’s robust social category. This represents the most familiar sorts of objects, people and relationships since it contains subscales for family (“mother”, “uncle”, “family”) and home (“kitchen”, “bathroom”). If science fiction contained an especially high rate of words in cognition and an especially low rate of words in social, then our data would confirm Suvin’s hypotheses and, potentially, falsify others’ hypotheses.
Our research question converts into an obvious hypothesis. We predicted that Suvin was correct: Science fiction will have high rates of cognition and estrangement. But we cannot simply calculate LIWC scores for science fiction texts and draw conclusions about our hypotheses. This is but one of several of our hypotheses in this study. But how are we to assess this?
Step 3: Compiling a dataset
In an earlier post I mentioned that there are a number of digital collections available to researchers, like the HathiTrust. But in some cases, none of those will do. In that case, a researcher must create a dataset. In our case we needed to compare science fiction work with writings in other genres in order to clarify, and answer, our research question. Reading literary studies work on genre, scholars appeared concerned to assess the difference between fantasy and science fiction. But a two-way comparison is much less robust and interesting than is a three-way comparison. Since we wanted to use a genre with the same sort of popular market as science fiction, we weighed adding romance, mystery or Western genre material to our test. We settled on mystery.
Making these decisions means we can make our hypotheses much more precise due to the number of comparisons available to us. For example, we reasoned that in a three way comparison, science fiction would have a higher mean rate of LIWC cognition words than would mystery, and that mystery would have a higher mean rate of LIWC cognition words than would fantasy.
Selecting what work to use within the science fiction, fantasy and mystery genres for our data analysis presented us with a problem. We don’t ourselves want to be the people to select just which stories or novels to use since that would leave us vulnerable to the objection that we cherry-picked our genre materials so as to confirm our hypotheses. We alighted on a strategy that allowed award-winning editors in these fields to do the selecting for us. It happens that these three genres are each supported by noteworthy ‘year’s best’ collections of short stories. We began buying used copies of these books and scanning them. Due to problems in the scans, we employed the optical character recognition function in Adobe Acrobat Pro on the texts, and followed this up with basic spellchecking. We then saved each short story as a separate .rtf file and ran the batches of files through LIWC to produce a preliminary dataset.
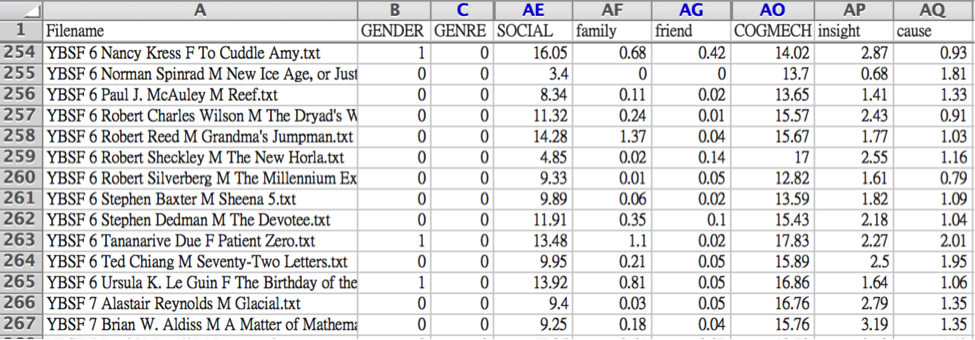
Screenshot of dataset displaying data for story, gender of author, genre, social, and cognition (COGMECH). Source: Author image
Step 4: Coding in metadata
Once we had a preliminary dataset, we then began coding metadata into it. This refers, in our case, to items like genre. We established a numerical code for genre: 1=Science Fiction, 2=Fantasy, and 3=Mystery, and each row in the LIWC excel sheet contains a number corresponding to that story’s genre. In addition, we coded in gender information after researching the gender of the authors of each story. For your own purposes, you will find other metadata more important than gender and genre. Perhaps you have a set of manuscripts of the same text and you want to use LIWC to look at the thematic changes wrought to that work by a single author over time. If so, date will be important for you to code in.
Step 5: Test hypotheses
The last step, most important step before writing up the experiment involves testing the hypotheses. As compared with previous steps, this does not take long at all. But that does not mean it is easy. Testing hypotheses with data involves selecting just the right test statistic. If you are comparing only two sets of LIWC data in your own research project, you’ll want to compare only two mean LIWC scores across categories.
To use LIWC to test hypotheses about the differences between two written works (or two sets of written works), t-testing is apt. In the present context, we have three groups of stories, or three ‘populations’. Right now let’s keep it simple and talk about differences between just two: the population of Fantasy stories and the population of SF stories. The content of each story in each of these populations has been computed by LIWC using its categories. To understand this, consider the screenshot above. Row 264 is represented by data from Ted Chaing’s brilliant story ‘Seventy-Two letters’. According to LIWC, 15.89% of the words in this story fall under the cognition (‘cogmech’) category. Right now we aren’t interested in the numerical values for individual stories across LIWC categories. Instead, we are interested in the bigger picture: how do the mean values of LIWC categories of interest vary across SF and Fantasy?
By ‘categories of interest’ I refer of course to cognition (‘cogmech’) and social (‘social’) since these are the categories relevant for testing our and Suvin’s hypotheses. A t-test allows you to easily calculate and then assess the variance between mean values in genres across LIWC categories like cogmech and social. T-test results can show whether the rate of variance between two mean values is significant or inconsequential. This highly rated video explains t-tests and how to do them in MS Excel.
This simplifies somewhat our experience by reducing the populations to only two. In our case, however, we needed to compare three sets of means to see if a significant difference exists among them. But the same underlying principles—comparing mean values—can be employed in an assessment of three or more populations, even though they are packaged in a different statistical test, an analysis of variance. We wanted to aggregate the stories together in three groups by genre in order to perform an Analysis of Variance (ANOVA). This can be done using just Microsoft Excel (see this video). If you’d like to get to know what an analysis of variance is, you could start with this video introduction. I am going to assume that the average humanist interested in text analysis who is reading this post probably does not know how to calculate an ANOVA.

ANOVA table for results from the cognition and social categories across three genres. ** and *** indicate the result is very statistically significant. Source: Nichols, Lynn & Purzycki 2014, 35
This is not the place to teach that skill. But I want to insist that this is not as difficult as it looks. In particular, if you succeed in steps 1-4, and you have the data prepped, cleaned-up and ready to analyze, you are likely to find it easy to collaborate with someone who can help you with t-tests or ANOVAs.
In our case, our pilot project confirmed Suvin’s interpretation of the science fiction genre and, we hope, offers some traction that others working in genre theory can use to their advantage. In our next post, we will walk through the use of LIWC for a project investigating Protestantism.